Gerber and Green(2012) Field Experiment, Ch.3
メモの続き.第3章はSampling Distributions, Statistical Inference, and Hypothesis Testingである.
3.1. Sampling Distribution
The term sampling distribution refers to the collection of estimates that could have been generated by every possible random assignment.
Rosenbaum(1984)ではrandomized distributionと呼んでいるが,標本分布のことを意味している.Ch.2の例では7つの村のうち2つをtreatmentとして扱ったが,2つのtreatmentの選び方は21通りあり,それぞれの組み合わせに応じてATEは変化する(つまり実験の結果はバイアスはないが必ずしも正確とは言えない).しかし,ランダム割り当て,除外制約,SUTVAを満たしていれば,推定されたATEの平均は真のATEに一致する.
3.2. The Standard Error as a Measure of Uncertainty
こうしたsampling variabilityの指標となるのが標準誤差である.標準誤差はばらつきの指標なので小さいとありがたい.ではどうしたら標準誤差を小さくできるのか?換言すれば,どうしたらより正確なATEを得るような実験をデザインできるのだろうか.Nをサンプルサイズ,mをtreatment unitのサイズとすると,推定されたATEの標準誤差は,
となることから,標準誤差を小さくするには以下4点がわかる.
- Nを大きくすると標準誤差は小さくなる
の分散を小さくすると標準誤差は小さくなる
を小さくすると標準誤差は小さくなる
の時に標準誤差は最も小さくなる
3.3. Estimating Sampling Variability
真の標準誤差はわからないので以下の式で推定しなければならない.
3.4. Hypothesis Testing
代表的な仮説検定は以下である.
Sharp Null Hypothesis of No Effect
全てのユニットについて因果効果がゼロ:
Null Hypothesis of No Average Effect
ATEがゼロ:\mu_{Y(1)}=\mu_{Y(0)}
こうした仮説検定をrandomization inferenceと呼び,以下で説明される.
Randomization Inference: The Sampling distribution of the test statistic under the null hypothesis is computed by simulating all possible random assignments. When the number of random assignments is too large to simulate, the sampling distribution may be approximated by a large sample of possible assignments. p-values are calculated by comparing the observed test statistic to the distribution of test statistics under the null hypothesis.
t値による検定もあるが,推定値の分布が歪んでいるときにも応用できるのはp-valueであり本書では後者を使っている.
3.5. Confidence Intervals
ATEがどのくらいの範囲にあるのかを知りたい時に区間推定を参照することがある.この場合には,推定されたATEを用いてPotential Outcomeに代入して信頼区間を推定する方法がある.Clingingsmith et al.(QJE 2009)ではPOの表を完成させ100000回のランダム割り当てをするシミュレーションをして信頼区間を求めている.
3.6. Sampling Distributions for Experiments that Use Block or Cluster Random Assignment
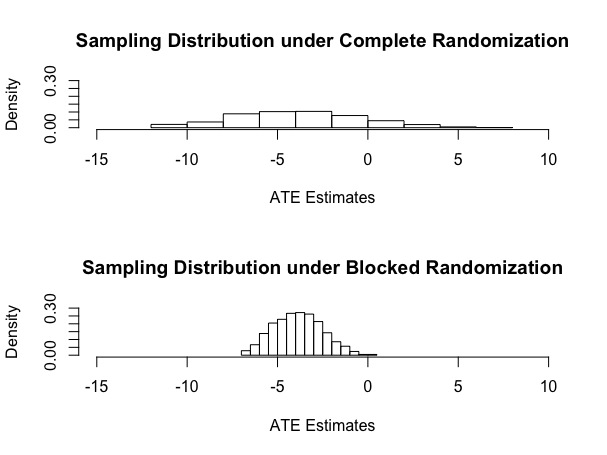
Block Random Assignmentとは対象者をサブグループに分けた上でランダム割り当てすることである.ランダム割り当てをしても処置群と対照群でバランスがとれていないことが起こる.例えば20人の対象者がいて,男女が半々とし,ランダム割り当てをすると,処置群に男性ばっかりもしくは女性ばっかりという可能性もなくはない.この場合,あらかじめ男女でサブグループに分けてランダム割り当てをすれば処置群と対照群で男女の比が同じになる.さらにBlock Random AssignmentはPOの分散が小さくなるので標準誤差が小さくなるという利点もあり,著者らは全てをプールした状態でのランダム割り当て=Complete Random Assignmentと比べてBlock Random Assignmentのほうが望ましいとしている.ちなみに全体のATEはブロックjのサイズを考慮してやればよいので以下となる.
Olsen(JPE 2007)の例ではBlock Random AssignmentとComplete Random AssignmentのATEの標準誤差の違いがはっきりと現れており分りやすい.以下のようにブロックしたATEの推定値のばらつきのほうが明らかに小さい.

ちなみにRスクリプトを以下.
rm(list=ls(all=TRUE))
library(ri)
set.seed(1234567)Y0 <- c(0,1,2,4,4,6,6,9,14,15,16,16,17,18)
Y1 <- c(0,0,1,2,0,0,2,3,12,9,8,15,5,17)Z <- c(1,1,0,0,0,0,0,0,0,0,0,0,1,1)
# generate all permutations of Z under _complete_ random assignment
# note that default is to do every possible permutation if less than 10,000 permutationscompperms <- genperms(Z)
numperms <- ncol(compperms)# create empty vector
compmeans <- rep(NA,numperms)# loop to create average treatment effect estimates for each randomization
for (i in 1:numperms) compmeans[i] <- mean(Y1[compperms[,i]==1]) - mean(Y0[compperms[,i]==0])# randomize within blocks
block <- c(1,1,1,1,1,1,1,1,2,2,2,2,2,2)# generate all permutations of Z under block random assignment
blockperms <- genperms(Z,block)
numperms <- ncol(blockperms)# create empty vector
blockmeans <- rep(NA,numperms)# loop to create average treatment effect estimates for each randomization
for (i in 1:numperms) blockmeans[i] <- weighted.mean(Y1[blockperms[,i]==1],c(8/2,8/2,6/2,6/2)) - weighted.mean(Y0[blockperms[,i]==0],c(8/6,8/6,8/6,8/6,8/6,8/6,6/4,6/4,6/4,6/4))save(compmeans,blockmeans,file="figure3.1.Rdata")
# Draw histograms
par(mfrow=c(2,1))
hist(compmeans,main="Sampling Distribution under Complete Randomization",xlim=c(-15,10),xlab="ATE Estimates",freq=FALSE,ylim=c(0,.3))
hist(blockmeans,main="Sampling Distribution under Blocked Randomization",xlim=c(-15,10),xlab="ATE Estimates",freq=FALSE,ylim=c(0,.3))# calculate the proportion of esitmates that are above zero
length(compmeans[compmeans > 0])
length(compmeans[compmeans > 0])/length(compmeans)length(blockmeans[blockmeans > 0])
length(blockmeans[blockmeans > 0])/length(blockmeans)
ブロックしたい共変量が明確な場合は以上の手順で実行可能だが,実際には共変量が多い場合などは何でブロックするかは悩ましいことがある.その場合にはどうしたら良いのだろうか.この点について,ルービンの講義を受けた時に彼は以下の会話をスライドで紹介していた.
Rubin: What if, in a randomized experiment, the chosen randomized allocation exhibited substantial imbalance on a prognostically important baseline covariate?
Cochran: Why didn't you block on that variable?
Rubin: Well, there were many baseline covariates, and the
correct blocking wasn't obvious; and I was lazy at that time.
Cochran: This is a question that I once asked Fisher, and his reply was unequivocal:
Fisher (recreated via Cochran): Of course, if the experiment had not been started, I would rerandomize.
実際に多くの場合にはフィールド実験の前に共変量がわかっていることはあまりないと思うので,実験前にバランスチェックするのが困難だと思うが,実験環境によってはルービンやフィッシャーがいうようにランダム割り当てをもう一回すれば良いのだろう.